Share/CLEF eHealth 2013 TASK 3 Results - QUTTOPSIG
This page summarises the results obtained from your submissions. Here, you can find the mean performance of your submissions, for all standard trec_eval measures and for nDCG at different ranks. For this first year, the Share/CLEF eHealth 2013 TASK 3 built result pools from your submissions considering the top 10 documents ranked by your baseline system (run 1), and the highest priority run that used the discharge summaries (run 2) and the highest priority run that did not used the discharge summaries (run 5). As a consequence:
- the primary measure for this year is precision at 10 (P@10),
- the secondary measure is Normalised Discounted Cumulative Gain at rank 10 (ndcg_cut_10).
Evaluation with standard trec_eval metrics
These results have been obtained with the binary relevance assessment, i.e. qrels.clef2013ehealth.1-50-test.bin.final.txt, and trec_eval 9.0 as distributed by NIST. Trec_eval was ran as follows:
./trec_eval -c -M1000 qrels.clef2013ehealth.1-50-test.bin.final.txt runName
QUTTOPSIG.1.3.noadd
runid                 	all	Topsig
num_q                 	all	50
num_ret               	all	50000
num_rel               	all	1858
num_rel_ret           	all	1478
map                   	all	0.1969
gm_map                	all	0.0536
Rprec                 	all	0.2344
bpref                 	all	0.3053
recip_rank            	all	0.5019
iprec_at_recall_0.00  	all	0.5495
iprec_at_recall_0.10  	all	0.4506
iprec_at_recall_0.20  	all	0.3462
iprec_at_recall_0.30  	all	0.2518
iprec_at_recall_0.40  	all	0.2159
iprec_at_recall_0.50  	all	0.1774
iprec_at_recall_0.60  	all	0.1401
iprec_at_recall_0.70  	all	0.1105
iprec_at_recall_0.80  	all	0.0812
iprec_at_recall_0.90  	all	0.0461
iprec_at_recall_1.00  	all	0.0052
P_5                   	all	0.3520
P_10                  	all	0.3540
P_15                  	all	0.3053
P_20                  	all	0.2760
P_30                  	all	0.2327
P_100                 	all	0.1330
P_200                 	all	0.0844
P_500                 	all	0.0499
P_1000                	all	0.0296
QUTTOPSIG.2.3.noadd
runid                 	all	Topsig
num_q                 	all	50
num_ret               	all	50000
num_rel               	all	1858
num_rel_ret           	all	1478
map                   	all	0.1965
gm_map                	all	0.0532
Rprec                 	all	0.2344
bpref                 	all	0.3058
recip_rank            	all	0.4569
iprec_at_recall_0.00  	all	0.5327
iprec_at_recall_0.10  	all	0.4683
iprec_at_recall_0.20  	all	0.3472
iprec_at_recall_0.30  	all	0.2518
iprec_at_recall_0.40  	all	0.2159
iprec_at_recall_0.50  	all	0.1774
iprec_at_recall_0.60  	all	0.1401
iprec_at_recall_0.70  	all	0.1105
iprec_at_recall_0.80  	all	0.0812
iprec_at_recall_0.90  	all	0.0461
iprec_at_recall_1.00  	all	0.0052
P_5                   	all	0.3520
P_10                  	all	0.3560
P_15                  	all	0.3053
P_20                  	all	0.2760
P_30                  	all	0.2327
P_100                 	all	0.1330
P_200                 	all	0.0844
P_500                 	all	0.0499
P_1000                	all	0.0296
QUTTOPSIG.3.3.noadd
runid                 	all	Topsig
num_q                 	all	50
num_ret               	all	50000
num_rel               	all	1858
num_rel_ret           	all	1443
map                   	all	0.1841
gm_map                	all	0.0430
Rprec                 	all	0.2197
bpref                 	all	0.2987
recip_rank            	all	0.3870
iprec_at_recall_0.00  	all	0.4738
iprec_at_recall_0.10  	all	0.4361
iprec_at_recall_0.20  	all	0.3354
iprec_at_recall_0.30  	all	0.2727
iprec_at_recall_0.40  	all	0.2193
iprec_at_recall_0.50  	all	0.1603
iprec_at_recall_0.60  	all	0.1300
iprec_at_recall_0.70  	all	0.0956
iprec_at_recall_0.80  	all	0.0745
iprec_at_recall_0.90  	all	0.0385
iprec_at_recall_1.00  	all	0.0059
P_5                   	all	0.3040
P_10                  	all	0.3240
P_15                  	all	0.3000
P_20                  	all	0.2600
P_30                  	all	0.2173
P_100                 	all	0.1258
P_200                 	all	0.0815
P_500                 	all	0.0476
P_1000                	all	0.0289
QUTTOPSIG.4.3.noadd
runid                 	all	TopISSL
num_q                 	all	50
num_ret               	all	50000
num_rel               	all	1858
num_rel_ret           	all	445
map                   	all	0.0340
gm_map                	all	0.0008
Rprec                 	all	0.0619
bpref                 	all	0.1562
recip_rank            	all	0.1350
iprec_at_recall_0.00  	all	0.1518
iprec_at_recall_0.10  	all	0.0948
iprec_at_recall_0.20  	all	0.0657
iprec_at_recall_0.30  	all	0.0442
iprec_at_recall_0.40  	all	0.0335
iprec_at_recall_0.50  	all	0.0298
iprec_at_recall_0.60  	all	0.0180
iprec_at_recall_0.70  	all	0.0129
iprec_at_recall_0.80  	all	0.0108
iprec_at_recall_0.90  	all	0.0000
iprec_at_recall_1.00  	all	0.0000
P_5                   	all	0.0720
P_10                  	all	0.0560
P_15                  	all	0.0480
P_20                  	all	0.0510
P_30                  	all	0.0580
P_100                 	all	0.0300
P_200                 	all	0.0202
P_500                 	all	0.0155
P_1000                	all	0.0089
QUTTOPSIG.5.3.noadd
runid                 	all	Topsig
num_q                 	all	50
num_ret               	all	50000
num_rel               	all	1858
num_rel_ret           	all	1443
map                   	all	0.1821
gm_map                	all	0.0427
Rprec                 	all	0.2197
bpref                 	all	0.2984
recip_rank            	all	0.3853
iprec_at_recall_0.00  	all	0.4685
iprec_at_recall_0.10  	all	0.4227
iprec_at_recall_0.20  	all	0.3387
iprec_at_recall_0.30  	all	0.2760
iprec_at_recall_0.40  	all	0.2193
iprec_at_recall_0.50  	all	0.1603
iprec_at_recall_0.60  	all	0.1300
iprec_at_recall_0.70  	all	0.0956
iprec_at_recall_0.80  	all	0.0745
iprec_at_recall_0.90  	all	0.0385
iprec_at_recall_1.00  	all	0.0059
P_5                   	all	0.3040
P_10                  	all	0.3240
P_15                  	all	0.3000
P_20                  	all	0.2600
P_30                  	all	0.2173
P_100                 	all	0.1258
P_200                 	all	0.0815
P_500                 	all	0.0476
P_1000                	all	0.0289
QUTTOPSIG.6.3.noadd
runid                 	all	Topsig
num_q                 	all	50
num_ret               	all	50000
num_rel               	all	1858
num_rel_ret           	all	1186
map                   	all	0.0724
gm_map                	all	0.0055
Rprec                 	all	0.0875
bpref                 	all	0.2533
recip_rank            	all	0.1761
iprec_at_recall_0.00  	all	0.2186
iprec_at_recall_0.10  	all	0.1496
iprec_at_recall_0.20  	all	0.1269
iprec_at_recall_0.30  	all	0.1110
iprec_at_recall_0.40  	all	0.0817
iprec_at_recall_0.50  	all	0.0697
iprec_at_recall_0.60  	all	0.0539
iprec_at_recall_0.70  	all	0.0446
iprec_at_recall_0.80  	all	0.0377
iprec_at_recall_0.90  	all	0.0257
iprec_at_recall_1.00  	all	0.0019
P_5                   	all	0.0880
P_10                  	all	0.0860
P_15                  	all	0.0973
P_20                  	all	0.0950
P_30                  	all	0.0840
P_100                 	all	0.0682
P_200                 	all	0.0541
P_500                 	all	0.0375
P_1000                	all	0.0237
Evaluation with nDCG
These results have been obtained with the graded relevance assessment, i.e. qrels.clef2013ehealth.1-50-test.graded.final.txt, and trec_eval 9.0 as distributed by NIST.To obtain nDCG at different ranks, trec_eval was ran as follows:
./trec_eval -c -M1000 -m ndcg_cut qrels.clef2013ehealth.1-50-test.graded.final.txt runName
QUTTOPSIG.1.3.noadd
ndcg_cut_5            	all	0.3185
ndcg_cut_10           	all	0.3293
ndcg_cut_15           	all	0.3082
ndcg_cut_20           	all	0.2975
ndcg_cut_30           	all	0.2875
ndcg_cut_100          	all	0.3521
ndcg_cut_200          	all	0.3816
ndcg_cut_500          	all	0.4155
ndcg_cut_1000         	all	0.4346
QUTTOPSIG.2.3.noadd
ndcg_cut_5            	all	0.3090
ndcg_cut_10           	all	0.3242
ndcg_cut_15           	all	0.3038
ndcg_cut_20           	all	0.2942
ndcg_cut_30           	all	0.2852
ndcg_cut_100          	all	0.3504
ndcg_cut_200          	all	0.3798
ndcg_cut_500          	all	0.4136
ndcg_cut_1000         	all	0.4328
QUTTOPSIG.3.3.noadd
ndcg_cut_5            	all	0.2651
ndcg_cut_10           	all	0.2846
ndcg_cut_15           	all	0.2829
ndcg_cut_20           	all	0.2695
ndcg_cut_30           	all	0.2635
ndcg_cut_100          	all	0.3296
ndcg_cut_200          	all	0.3554
ndcg_cut_500          	all	0.3838
ndcg_cut_1000         	all	0.4076
QUTTOPSIG.4.3.noadd
ndcg_cut_5            	all	0.0672
ndcg_cut_10           	all	0.0619
ndcg_cut_15           	all	0.0586
ndcg_cut_20           	all	0.0622
ndcg_cut_30           	all	0.0726
ndcg_cut_100          	all	0.0904
ndcg_cut_200          	all	0.1019
ndcg_cut_500          	all	0.1187
ndcg_cut_1000         	all	0.1298
QUTTOPSIG.5.3.noadd
ndcg_cut_5            	all	0.2617
ndcg_cut_10           	all	0.2820
ndcg_cut_15           	all	0.2805
ndcg_cut_20           	all	0.2671
ndcg_cut_30           	all	0.2609
ndcg_cut_100          	all	0.3265
ndcg_cut_200          	all	0.3523
ndcg_cut_500          	all	0.3808
ndcg_cut_1000         	all	0.4045
QUTTOPSIG.6.3.noadd
ndcg_cut_5            	all	0.0814
ndcg_cut_10           	all	0.0778
ndcg_cut_15           	all	0.0852
ndcg_cut_20           	all	0.0877
ndcg_cut_30           	all	0.0896
ndcg_cut_100          	all	0.1362
ndcg_cut_200          	all	0.1753
ndcg_cut_500          	all	0.2065
ndcg_cut_1000         	all	0.2328
Plots P@10
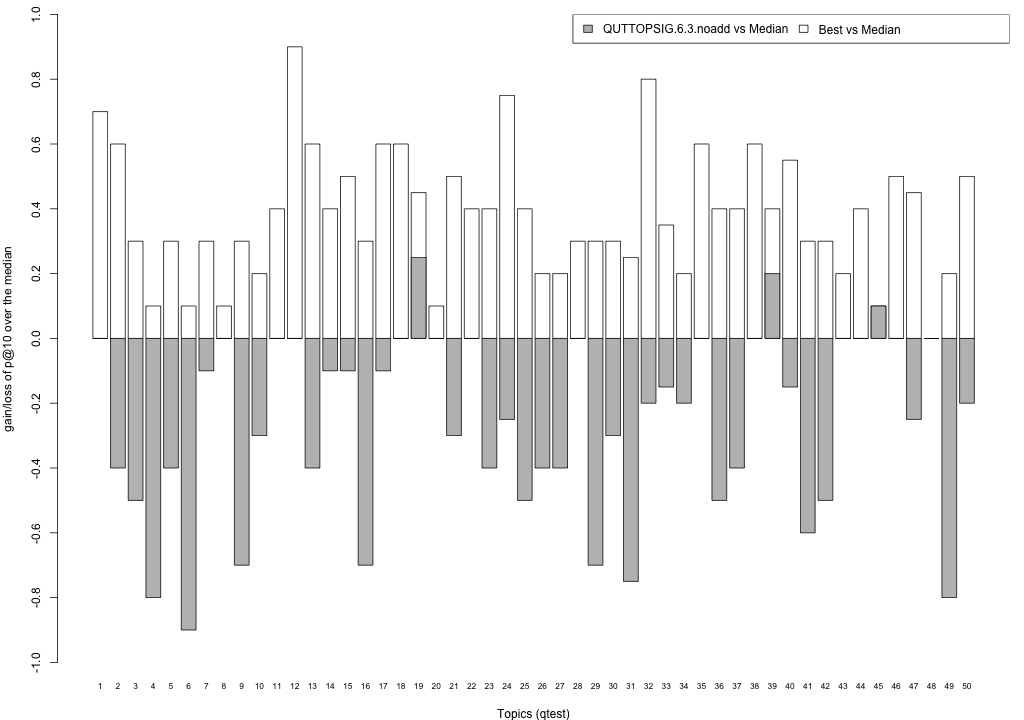
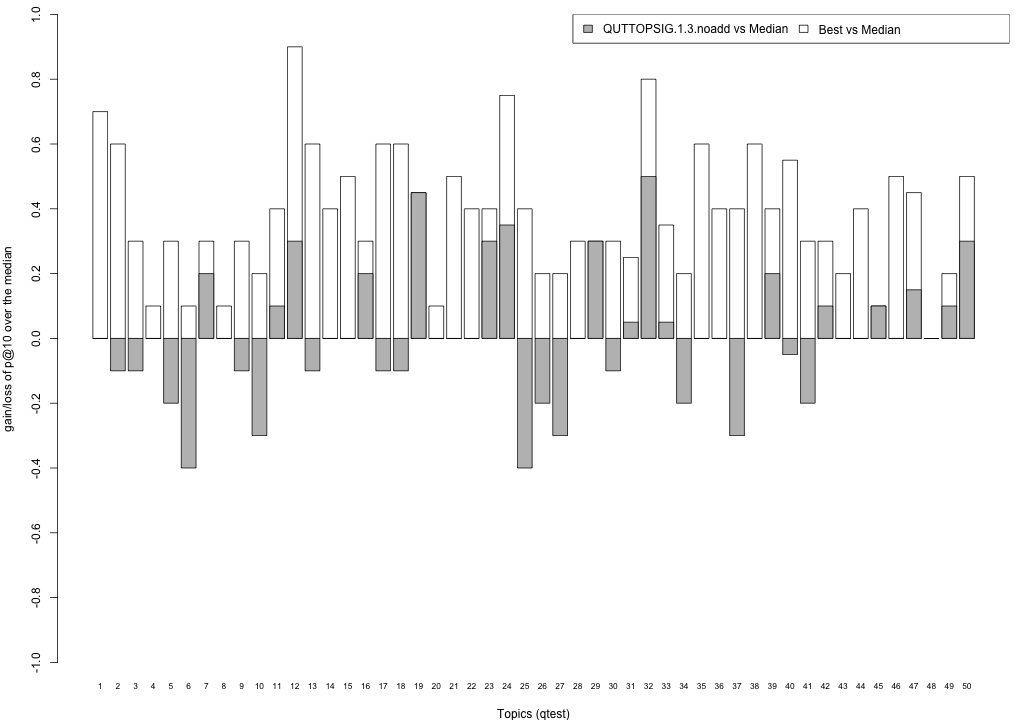
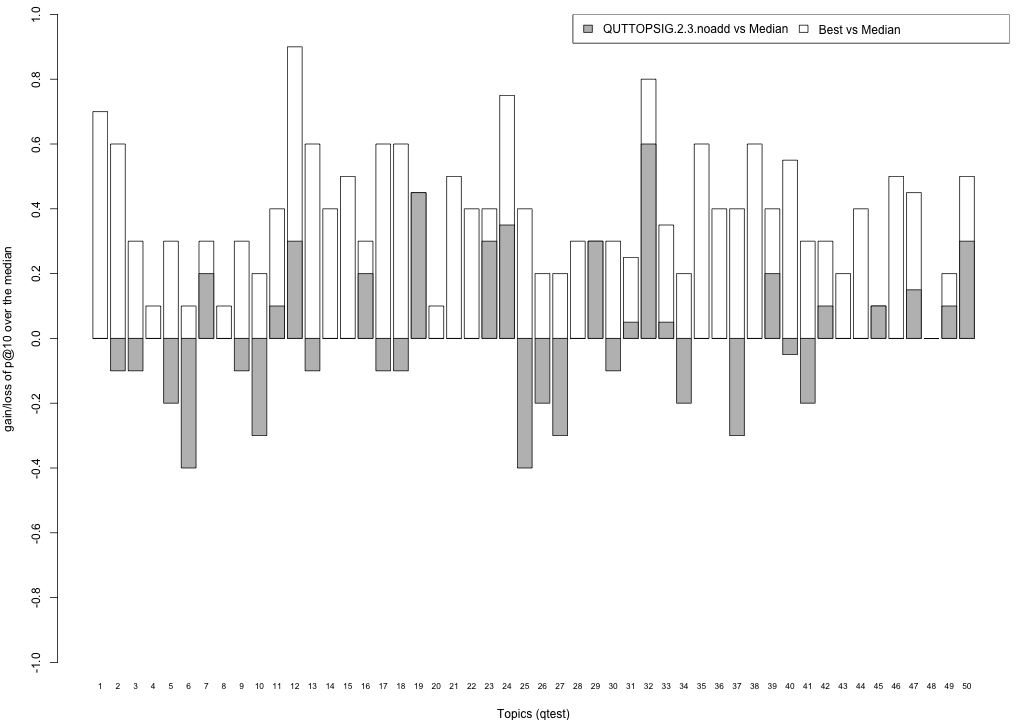
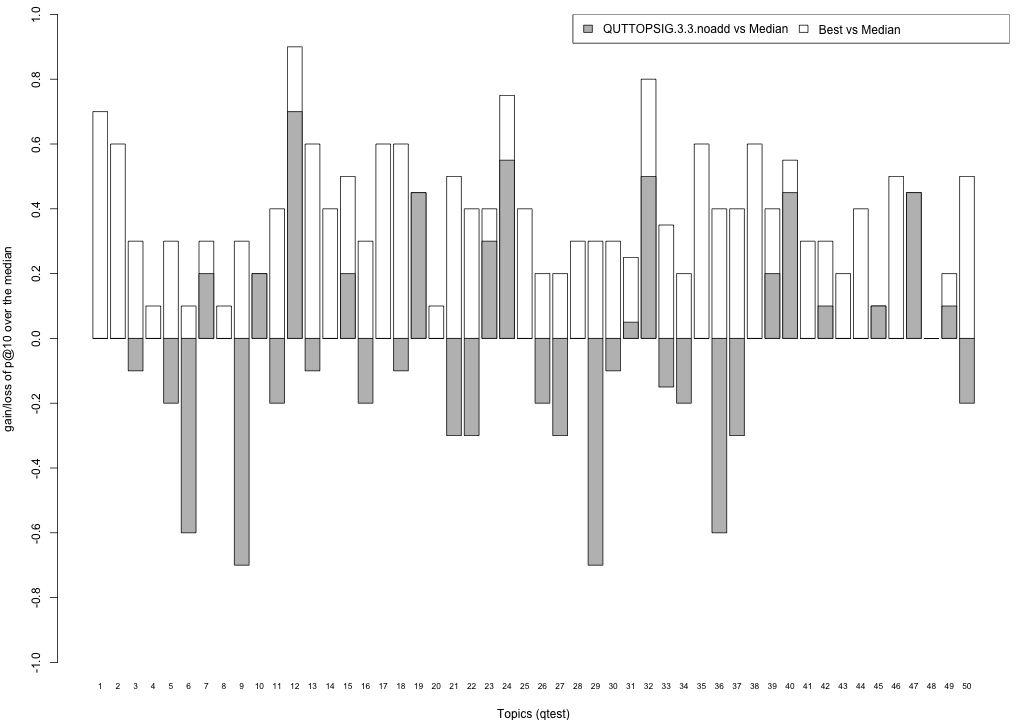
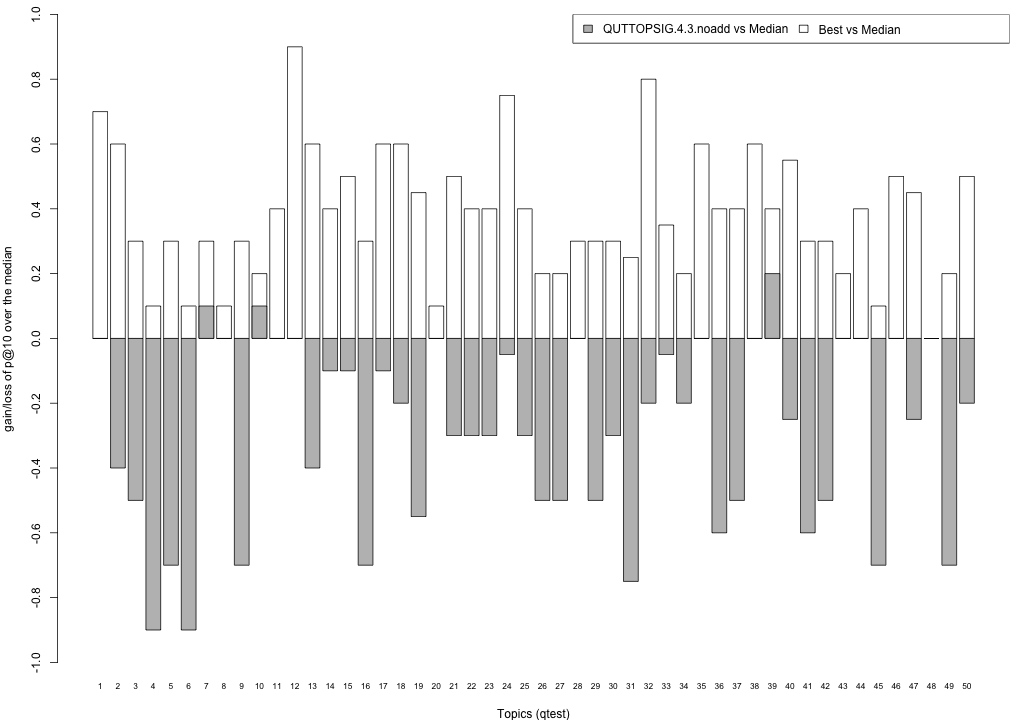
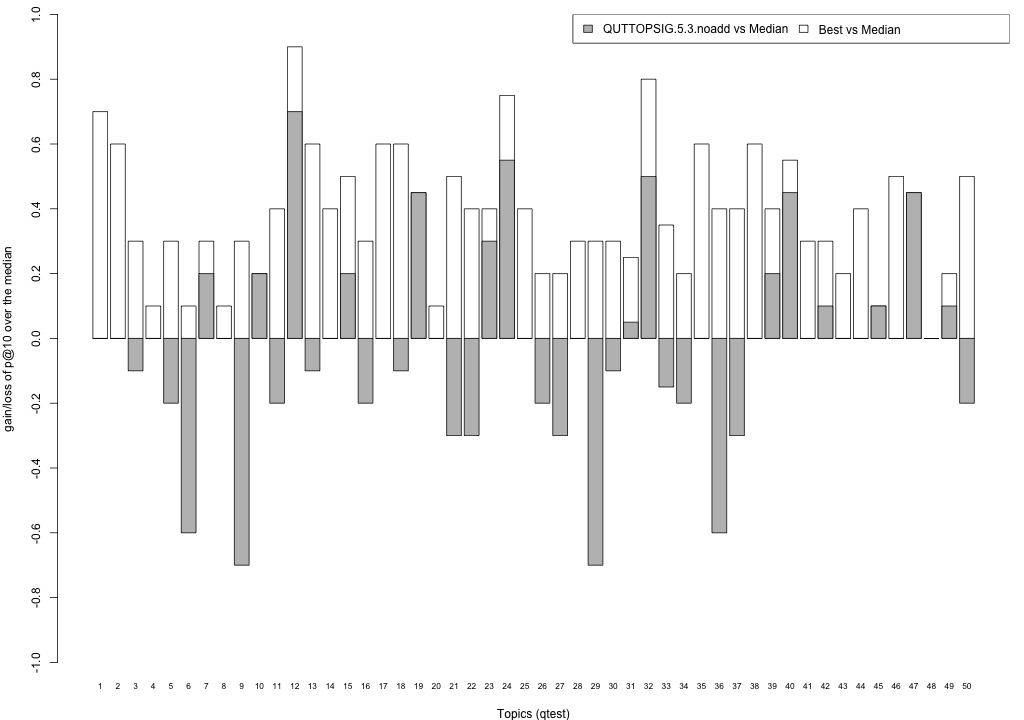
The plots below compare each of your runs against the median and best performance (p@10) across all systems submitted to CLEF for each query topic. In particular, for each query, the height of a bar represents the gain/loss of your system and the best system (for that query) over the median system. The height of a bar in then given by:
grey bars:   height(q) = your_p@10(q) - median_p@10(q)
white bars:  height(q) = best_p@10(q) - median_p@10(q)
QUTTOPSIG.1.3.noadd
QUTTOPSIG.2.3.noadd
QUTTOPSIG.3.3.noadd
QUTTOPSIG.4.3.noadd
QUTTOPSIG.5.3.noadd
QUTTOPSIG.6.3.noadd
